Is Waymo Safer Than a Human Driver? 271M Miles Tested. 95% Fewer Serious Crashes on City Streets, a Freeway Recall, and the Limits of a Company-Run Benchmark
What Waymo's June 2026 safety data shows, how the human comparison is built, and where the numbers stop.
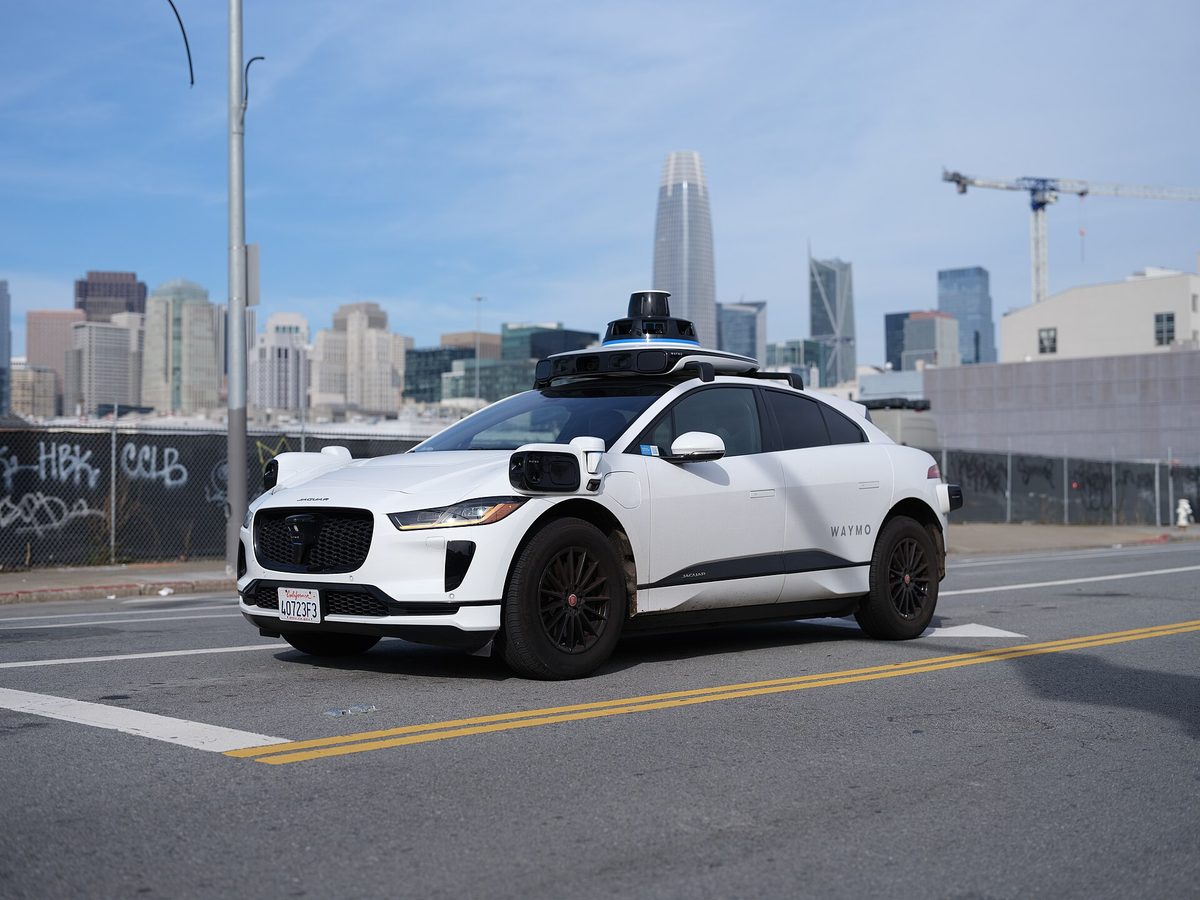
Waymo says its driverless cars crash far less than people do. After 271.3 million miles with no one behind the wheel, the company's own figures put serious-injury crashes at 95% below a human benchmark. That is a big claim, and if you are deciding whether to hail one in Phoenix, Austin or Miami, or just trying to figure out how much of the robotaxi pitch to believe, it helps to know what the number measures, what it leaves out and what has gone wrong along the way.
This guide walks through the latest Waymo safety data as published in 2026, how the comparison is built, what independent checks exist, and where the numbers stop being useful.
What Waymo reports, through June 2026
Waymo's Safety Impact hub covers 271.3 million rider-only miles, meaning miles driven with no human driver in the vehicle. The miles are spread across five metro areas: Phoenix (92.1 million), the San Francisco Bay Area (82.4 million), Los Angeles (67.1 million), Austin (21.1 million) and Atlanta (8.6 million). Compared with a human benchmark for the same kinds of roads, Waymo reports large reductions in every crash category it tracks.
Waymo's headline numbers versus human drivers The table below is the company's own comparison, surface streets only, through June 2026.
The last three rows matter most for anyone who shares the road with these cars on foot or on two wheels. Pedestrian injury crashes are 93% lower in Waymo's data, a gap of 87 crashes, and the reduction for cyclists and motorcyclists is 86% and 82%.
How the comparison is built
Waymo does not simply divide its crashes by its miles and compare against national statistics. The human side of the comparison comes from police-reported crashes and vehicle miles traveled in Phoenix, San Francisco, Los Angeles and Austin, adjusted for where and how Waymo actually drives (a method from Chen et al., 2024). The Waymo side comes from crash reports filed under NHTSA's Standing General Order, which requires automated-driving companies to report crashes to the federal regulator.
Three details are worth knowing. First, freeways are excluded from the benchmark, so the figures describe city and suburban surface streets. Second, the any-injury benchmark includes a 32% adjustment for crashes that humans never report to police; without it, Waymo's advantage would look smaller. Third, results are counted as crashed vehicles per mile rather than crashes per mile, and each figure carries a 95% confidence interval.
The methodology has been published in the peer-reviewed journal Traffic Injury Prevention. Kusano et al. covered 56.7 million rider-only miles in a 2025 paper, and Waymo's research page lists further 2026 papers on benchmark design and on crash involvement by time of day and day of week. Those papers are written by Waymo researchers, which is a point in favor of transparency but not of independence.
The independent check: insurance claims
The strongest outside evidence is not a crash database at all. Researchers at the reinsurer Swiss Re, working with Waymo, compared Waymo's auto liability insurance claims over 25.3 million miles with claims from comparable human-driven vehicles, including the newest models with modern driver-assist systems (Di Lillo et al., 2024). Waymo summarizes the result as 92% fewer bodily injury claims and 88% fewer property damage claims. Insurance claims are a useful cross-check because they record what an insurer actually paid, not what a company chose to report. The study stopped at 25 million miles, though, and the fleet is now more than ten times that.
What the numbers do not tell you
**Fatal crashes are still too rare to measure.** Serious-injury and fatal crashes are the least frequent kind, and even 271 million miles is not enough to draw a confident conclusion about fatalities alone. The 95% fewer serious-injury figure rests on a small count of events: 55 fewer than expected.
**The benchmark is a model, not a control group.** Humans and Waymo do not drive the same trips. Waymo operates inside defined service areas in a limited set of cities, and its trips are not a random sample of American driving. The benchmark adjustments try to correct for this, but any adjustment involves judgment.
**Absolute incident counts rise as the fleet grows.** A company can have a far lower rate per mile and still produce more total incident reports each year, because there are more cars and more miles. Critics point to this, and it is true, but a rate is the right yardstick for the question of whether a robotaxi is safer than a human driver.
**The data is company-published.** Waymo computes and posts the figures. The underlying crash reports are public through NHTSA, but the benchmark and the analysis are Waymo's.
The June 2026 recall
Safety records are not only about rates. In June 2026 Waymo recalled 3,871 robotaxis with its fifth-generation driving system (NHTSA campaign 26E035000). The software could let a vehicle enter a closed freeway construction zone and keep driving at speed, because it prioritized avoiding other freeway hazards or failed to recognize the work zone. Waymo logged 13 incidents in April and May, six near Phoenix and seven in the Bay Area, and on May 18 seven vehicles drove between cones into active freeway work lanes. Waymo suspended highway driving on May 19 while it developed a software fix, and restricted affected vehicles from freeways in the meantime.
The recall is a good illustration of how to read the headline numbers. The 95% figure covers surface streets, and the recall concerned freeways, which the benchmark excludes. A robotaxi can be far safer than a human on a city grid and still have a software flaw somewhere else, and a recall is the system working as designed: the company found the problem, reported it to the regulator and pulled the capability back until it was fixed.
What a rider can do with this
Waymo's ride-hailing page lists service in 15 US metro areas: Atlanta, Austin, Dallas, Denver, Houston, Las Vegas, Los Angeles, Miami, Nashville, Orlando, Phoenix, San Antonio, San Diego, the San Francisco Bay Area and Tampa. Boston, Baltimore and New York are listed as up next. If you live in one of them, a few practical points follow from the data.
Treat the numbers as strong evidence for city streets in the markets where the miles were driven, which are Phoenix, San Francisco, Los Angeles and Austin. The newer markets have far fewer miles behind them, Atlanta with 8.6 million for instance, so the statistics are thinner there even though the same software runs the cars.
Do not read the numbers as a guarantee for any single ride. A rate lower than a human's is not zero, and the data says nothing about your trip. What it supports is a narrower claim: over a very large number of city miles, the Waymo Driver was involved in far fewer injury crashes than the benchmark predicts.
If you are a pedestrian or cyclist sharing streets with the cars, the vulnerable-road-user numbers are the most relevant, and they are also the ones with the clearest direction: fewer injury crashes in every category Waymo reports.
How the car sees
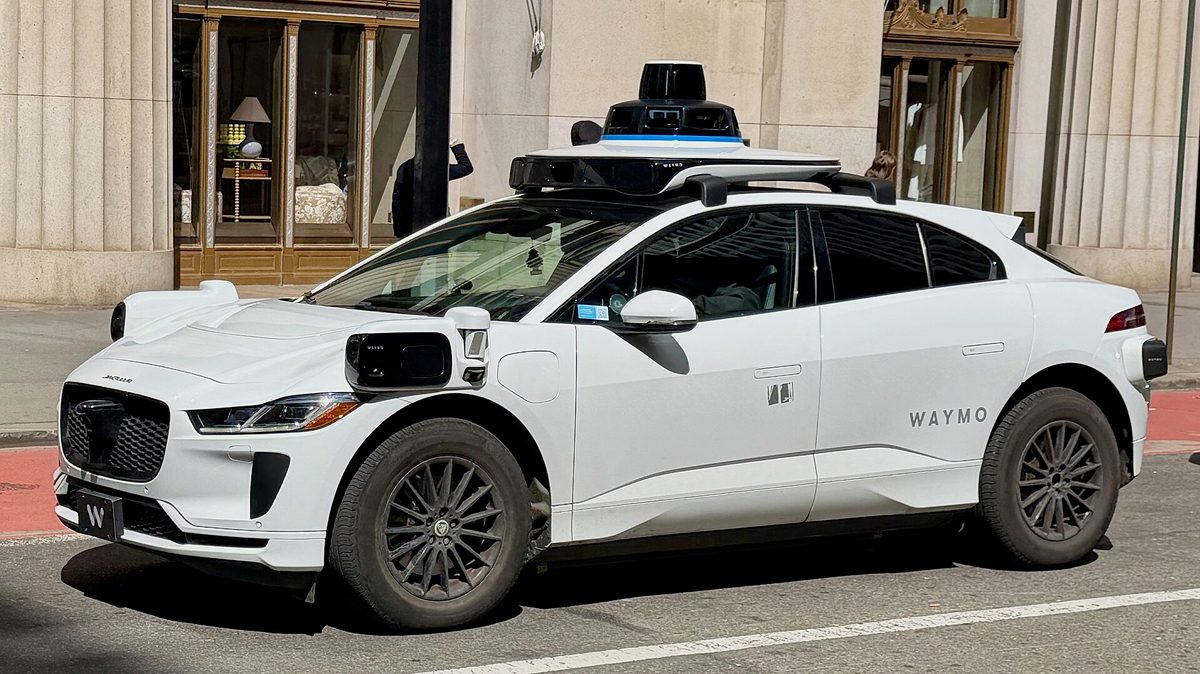
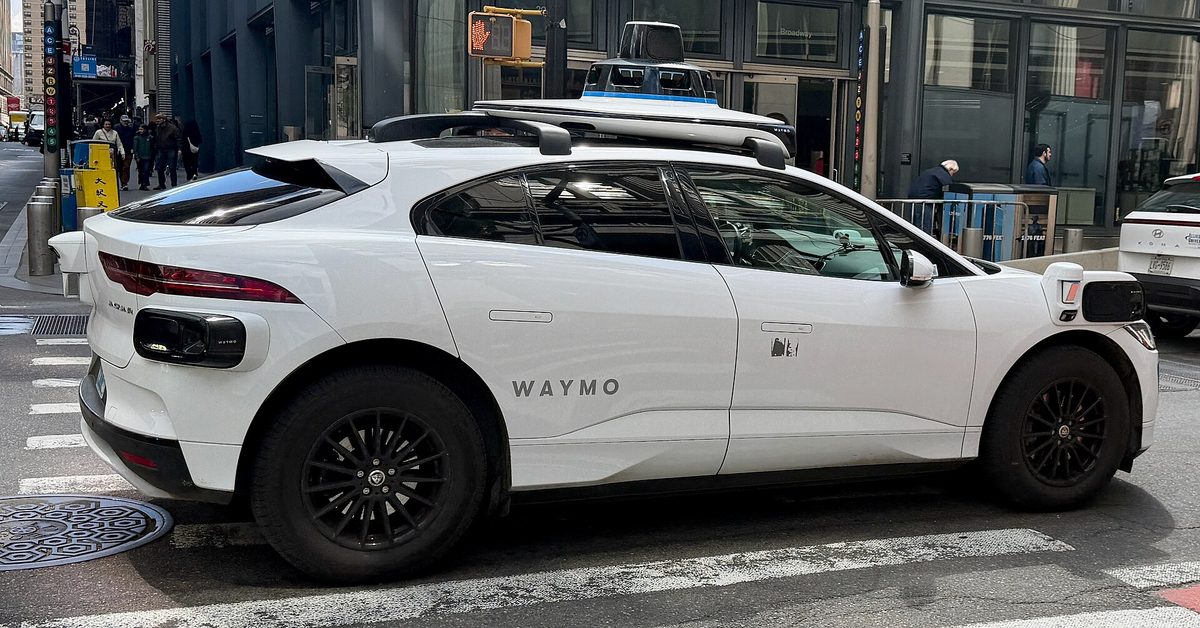
The vehicle in the photos, a Jaguar I-Pace, carries a roof dome of lidar and cameras plus radar in the front fenders and bumpers. Waymo's own explanation of why it uses all three sensor types is in the video attached to this article: each sensor fails in different conditions, and the driving system fuses the three so that one weak input does not decide what the car does. Redundancy of this kind is a large part of what separates a robotaxi from the driver-assist systems sold in consumer cars, which still expect a human to supervise.
Questions worth asking about any robotaxi safety claim
When any company, Waymo or a competitor, quotes a safety statistic, four questions separate a useful number from a marketing one. How many driverless miles stand behind it, and were they driven without a human supervisor? What is it compared against, and was the comparison adjusted for road type and location? Does it include freeways, bad weather and night driving, or only the easy miles? And can anyone outside the company check it, through regulator filings, an insurer or a peer-reviewed paper? Waymo's data is unusually complete on the first two and has outside support on the fourth, but the third is exactly where the June recall showed the weak spot.
Bottom line
On the evidence available in November 2026, Waymo's driverless cars have a considerably lower rate of injury crashes than human drivers on the city streets where they operate, and an insurer-backed study points the same way. The result is strong enough to take seriously and not yet strong enough to settle every question: fatal crashes are too rare to count, freeway driving was paused after the June recall, and the analysis is published by the company that benefits from it. Check waymo.com/safety/impact for updated figures, since the data is refreshed in line with NHTSA reporting.
| Crash type (surface streets) | Reduction vs human benchmark | Crashes avoided |
|---|---|---|
| Serious injury or worse | 95% fewer | 55 |
| Any injury reported | 82% fewer | 841 |
| Airbag deployment, any vehicle | 82% fewer | 357 |
| Pedestrian injury | 93% fewer | 87 |
| Cyclist injury | 86% fewer | 56 |
| Motorcyclist injury | 82% fewer | 36 |
Related cars
Related articles
- NACS vs CCS: Which EV Charging Plug Matters in 2026? Who Can Use Superchargers, What You Need to Carry, and Why a Port Does Not Set Your Charging Speed
- EV Range Explained: Why the EPA Number Isn't What You Get — How the Sticker Is Built, a 215-Mile Highway Test Against a 259-Mile Rating, and a 63-Mile Spread Inside One Model
- Cybertruck Production Ending Mid-2027, Musk Says — Tesla Gives Up Its Stainless Pickup After Three Years to Make Room for the Cybercab
- Is the Rivian R1T Worth It in 2026? A Buyer's Guide — Quad Max Hits 60 MPH in 2.5 Seconds, But the All-Touchscreen Cabin and $123,885 Sticker Are the Real Trade-Offs
Sources
- Waymo — Safety Impact hub (data through June 2026)
- Waymo — Safety research and publications
- Waymo — Ride with Waymo: cities served
- Kusano et al. — Waymo rider-only crash rates by crash type vs human benchmarks at 56.7 million miles (Traffic Injury Prevention, 2025)
- NHTSA recall campaign 26E035000 — Waymo, via Vehicle Safety Recalls
- The Washington Times — Waymo recalls 3,800 vehicles that drove into construction zones (June 19, 2026)